Back to: Machine Learning
Regression in Machine Learning
Regression is a statistical technique used to predict a continuous outcome (dependent variable) based on one or more input features (independent variables). The main goal of regression is to identify the relationship between the variables, recognize patterns, and make predictions for future data.
Examples:
- Predicting Weight: For example, you can predict someone’s weight based on their height.
- House Price Prediction: Regression can help estimate house prices using factors like size, location, and the number of rooms.
Common Regression Algorithms:
- Linear Regression:
- Simple Linear Regression: Predicts the dependent variable using a straight-line relationship with one independent variable.
- Multiple Linear Regression: Extends simple linear regression by using multiple independent variables to predict the dependent variable.
- Ridge Regression (L2 Regularization):
- A variation of linear regression that adds a penalty term to prevent overfitting, which helps by shrinking the coefficients of less important features.
- Lasso Regression (L1 Regularization):
- Similar to ridge regression, but it uses an L1 penalty that can set some coefficients to zero, performing automatic feature selection.
- Polynomial Regression:
- Models the relationship between the dependent and independent variables as an n-th degree polynomial. This is useful when the relationship between the variables is non-linear.
Simple Linear Regression
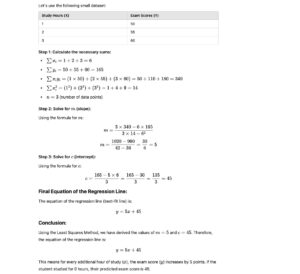
Given the following data:
Study Hours (X): 1, 2, 3, 4, 5, 6, 7, 8, 9, 10
Exam Scores (Y): 50, 55, 60, 65, 70, 75, 80, 85, 90, 95
In this case:
- Study Hours (X) are the independent variable (input).
- Exam Scores (Y) are the dependent variable (output).
Problem:
What is the exam score of a student who studied for 5 hours?
We can use Simple Linear Regression to predict the exam score based on the number of study hours.
The Equation of the Regression Line:
The regression line is expressed as:
Y=mX+c
Where:
- Y is the predicted exam score,
- m is the slope of the line,
- X is the number of study hours,
- c is the y-intercept
We are given the value of X (5 hours), but we need to find the values of m and c to make the prediction.
How to Identify m and c?
To find the values of m and c, we need to minimize the error between the actual values of the exam scores and the predicted values. The most common way to do this is by using the Least Squares Method.
Least Squares Method
The Cost Function (also known as the Error Function) is used to measure the accuracy of the regression line. The most commonly used cost function in regression is the Mean Squared Error (MSE), which calculates the average of the squared differences between the actual values and the predicted values.
The Sum of Squared Errors (SSE) function:
The Sum of Squared Errors (SSE) is used to quantify how well the regression model fits the data. It calculates the sum of the squared differences between the observed (actual) values and the predicted values.
The formula for SSE is:

Explanation:
- For each data point, calculate the difference between the actual value yi and the predicted value yi cap.
- Square this difference to remove negative values.
- Sum all the squared differences across all data points.
Example

To calculate the slope (m) and intercept (c) using the Least Squares Method with partial derivatives, we need to minimize the Sum of Squared Errors (SSE). This involves calculating the derivative of the error function with respect to m and c, setting the derivatives equal to zero, and solving for m and c.


Example of calculating m and c