Back to: Machine Learning
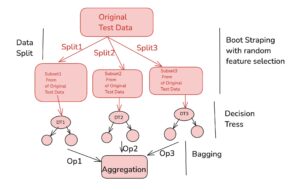
Random Forest is an ensemble learning algorithm that extends the bagging technique to improve the performance of decision trees. It involves building multiple decision trees on bootstrapped samples of the data, with the added step of random feature selection at each split. After the trees are trained, their predictions are aggregated to make a final decision, enhancing accuracy and reducing overfitting compared to individual decision trees.
EXAMPLE
Dataset:
| Study Hours | Attendance (Days) | Target (Pass/Fail) |
|---|---|---|
| 3 | 15 | Pass |
| 5 | 20 | Pass |
| 2 | 10 | Fail |
| 4 | 18 | Pass |
Step 1: Bootstrapping
Bootstrapping is a technique where we sample data with replacement. This means we randomly select data points, and some data points might be selected multiple times, while others might not be selected at all.
Bootstrap Sample 1:
We create the first bootstrapped sample by randomly selecting data points (with replacement):
| Study Hours | Attendance (Days) | Target (Pass/Fail) |
|---|---|---|
| 5 | 20 | Pass |
| 3 | 15 | Pass |
| 4 | 18 | Pass |
| 3 | 15 | Pass |
Bootstrap Sample 2:
Now, create the second bootstrapped sample by randomly selecting data points again:
| Study Hours | Attendance (Days) | Target (Pass/Fail) |
|---|---|---|
| 2 | 10 | Fail |
| 5 | 20 | Pass |
| 4 | 18 | Pass |
| 2 | 10 | Fail |
Step 2: Building Decision Trees
Now that we have two bootstrapped samples, we’ll build a simple decision tree for each sample. We will split the data based on Study Hours and Attendance.
Decision Tree for Bootstrap Sample 1:
In Bootstrap Sample 1, we have the following data:
| Study Hours | Attendance (Days) | Target (Pass/Fail) |
|---|---|---|
| 5 | 20 | Pass |
| 3 | 15 | Pass |
| 4 | 18 | Pass |
| 3 | 15 | Pass |
Let’s try splitting the data based on Study Hours first:
- If Study Hours ≤ 3:
- Data: [3, 15] → Pass
- Prediction: Pass
- If Study Hours > 3:
- Data: [5, 20], [4, 18] → Pass
- Prediction: Pass
So, the decision tree based on Study Hours looks like:
This tree will predict Pass for all data points because all points in the sample are Pass.
Decision Tree for Bootstrap Sample 2:
In Bootstrap Sample 2, we have the following data:
| Study Hours | Attendance (Days) | Target (Pass/Fail) |
|---|---|---|
| 2 | 10 | Fail |
| 5 | 20 | Pass |
| 4 | 18 | Pass |
| 2 | 10 | Fail |
Let’s try splitting the data based on Study Hours first:
- If Study Hours ≤ 3:
- Data: [2, 10], [2, 10] → Fail
- Prediction: Fail
- If Study Hours > 3:
- Data: [5, 20], [4, 18] → Pass
- Prediction: Pass
So, the decision tree based on Study Hours looks like:
This tree will predict Fail for study hours ≤ 3 and Pass for study hours > 3.
Step 3: Making Predictions with Each Tree
Now, let’s make predictions for a new data point: Study Hours = 4, Attendance = 18.
- Prediction using Decision Tree 1 (from Bootstrap Sample 1):
- Study Hours = 4 falls in the Study Hours > 3 branch.
- Prediction: Pass
- Prediction using Decision Tree 2 (from Bootstrap Sample 2):
- Study Hours = 4 falls in the Study Hours > 3 branch.
- Prediction: Pass
Step 4: Aggregating Predictions (Majority Voting)
Finally, we aggregate the predictions from both decision trees using majority voting:
- Decision Tree 1 predicts Pass.
- Decision Tree 2 predicts Pass.
Since both decision trees predict Pass, the final prediction is Pass.
Summary of Steps:
- Bootstrapping: We created two bootstrapped samples by randomly selecting data points with replacement.
- Decision Tree Creation: We built simple decision trees based on Study Hours for both bootstrapped samples.
- Prediction: We made predictions using the decision trees.
- Aggregation: We aggregated the predictions using majority voting to get the final result.