Back to: Machine Learning
1. K-Means Clustering Overview
K-Means is a popular partitioning-based clustering algorithm used in unsupervised learning to group similar data points into K distinct clusters. The basic idea is to minimize the variance within each cluster by iteratively adjusting the cluster centroids and assigning data points to the closest centroids.
2. Application of K-Means Clustering
K-Means clustering is widely used in various applications, such as:
- Customer Segmentation: Grouping customers into distinct segments based on purchasing behavior.
- Market Basket Analysis: Finding similar products bought by customers to recommend items.
- Image Compression: Reducing the number of colors in an image by clustering pixels.
- Document Clustering: Grouping similar documents together in text mining and natural language processing.
- Anomaly Detection: Identifying data points that don’t belong to any cluster or belong to a sparse cluster.
- Medical Imaging: Segmenting regions of interest in medical images (e.g., MRI or CT scans).
3. Advantages of K-Means
- Simplicity: K-Means is easy to understand and implement.
- Efficiency: It can be computationally efficient and works well with large datasets.
- Scalability: K-Means performs well with large datasets when the number of features is not too high.
- Convergence: The algorithm generally converges quickly (though it may get stuck in local minima).
- Flexibility: It can be used for different types of applications, especially in clustering continuous data.
4. Disadvantages of K-Means
- Need to specify KK: You need to predefine the number of clusters (KK), which may not be easy without prior knowledge.
- Sensitivity to initial centroids: The final results can depend on the initial choice of centroids, which may lead to different results with different initializations.
- Assumes spherical clusters: K-Means tends to work best when clusters are spherical (globular), so it struggles with non-convex or elongated clusters.
- Sensitive to outliers: Outliers can significantly affect the centroids and the final clustering.
- Non-deterministic: K-Means can converge to different solutions depending on the initialization of centroids.
5. K-Means Algorithm Calculation Using Sample Data
Let’s calculate K-Means clustering using sample real-time data (for example, customer data with two features: annual income and spending score).
Step 1: Sample Data
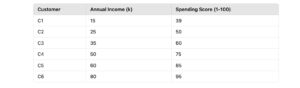
We have 6 customers, each with two features: annual income (in thousands) and spending score (a value between 1-100).
Step 2: Choose the Number of Clusters (K)
Let’s assume we want to cluster the data into 2 clusters (K=2K = 2).
Step 3: Initialize Centroids
Randomly initialize two centroids (e.g., from the existing data points):
- Centroid 1: C1=(15,39)
- Centroid 2: C2=(50,75)
Step 4: Assign Points to the Nearest Centroid
Calculate the Euclidean distance between each data point and the centroids.
The Euclidean distance formula between two points (x1,y1) and (x2,y2) is:
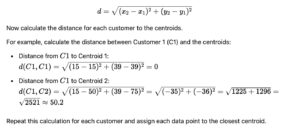
Step 5: Update Centroids
Recalculate the centroids based on the data points assigned to each cluster. The new centroid is the mean of the points in the cluster.
For example, if customers C1, C2, and C3 are assigned to Cluster 1, the new centroid for Cluster 1 would be the average of their annual incomes and spending scores.
Step 6: Repeat Until Convergence
Repeat steps 4 and 5 until the centroids no longer change or the algorithm converges.
Example Calculation for One Iteration
- Assume that in the first iteration, the data points are assigned to the following clusters:
- Cluster 1: Customers C1, C2, C3
- Cluster 2: Customers C4, C5, C6
Now calculate the new centroids:
- New Centroid for Cluster 1:

- New Centroid for Cluster 2:
