Back to: Machine Learning
Decision trees
Decision trees are basic machine learning tools used for classification and regression.
Classification Task Example
- Predicting whether an email is spam or not spam.
Regression Task Example
- Predicting the price of a house based on features like size, location, and number of rooms.
Structure of a Decision Tree
Nodes
- Each node represents a feature in the dataset.
Decision Nodes
- These nodes split into branches based on the value of a feature.
Leaf Nodes
- Terminal nodes that provide the final output or prediction.
- In classification, each leaf node corresponds to a class label (e.g., Yes/No).
- In regression, each leaf node represents a numerical value (e.g., predicted price).
Example
Features and Class Labels
- Feature: Weather (Sunny, Rainy).
- Class Label: Play (Yes, No).
Decision Tree Structure
- Root Node: Weather.
- If Sunny → Yes (Play).
- If Rainy → No (Don’t Play).
This example shows how features (Weather) and class labels (Play) are used to make predictions in a decision tree.
Splitting Criteria in Decision Trees
The splitting criteria decide how the data is divided at each decision point in a decision tree. The goal is to make the data in each group as pure or accurate as possible.
1. For Classification Tasks
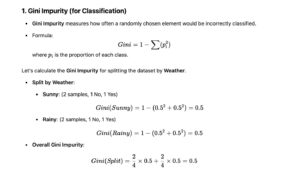
- Gini Impurity:
- Measures how mixed the classes are in a group.
- A lower Gini value means better separation of classes.
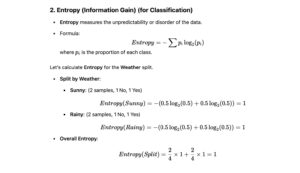
- Entropy (Information Gain):
- Measures the disorder or randomness in the data.
- A higher Information Gain means the split is better at reducing uncertainty.
2. For Regression Tasks
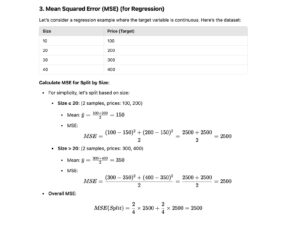
- Mean Squared Error (MSE):
- Measures the average squared difference between predicted and actual values.
- Lower MSE means a more accurate prediction.
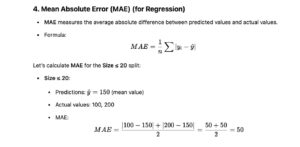
- Mean Absolute Error (MAE):
- Measures the average absolute difference between predicted and actual values.
- Lower MAE means less error in predictions.
Example of Splitting Criteria in Decision Trees
Let’s take a simple dataset to explain Gini Impurity, Entropy, Mean Squared Error (MSE), and Mean Absolute Error (MAE).
Dataset:
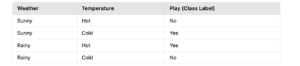
Summary
- Gini Impurity: Measures how mixed the classes are; lower values indicate better splits.
- Entropy: Measures the disorder in the dataset; higher values indicate more uncertainty.
- MSE: Measures prediction accuracy by averaging squared errors; lower values indicate better splits.
- MAE: Measures prediction accuracy by averaging absolute errors; lower values indicate better splits.
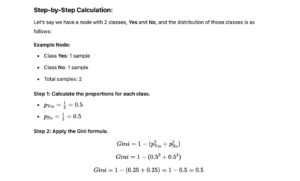
The Gini Impurity value of 0.5 indicates that the classes are perfectly mixed (50% of Yes and 50% of No), which is the case when the class distribution is balanced. A Gini Impurity of 0 represents a pure node (all samples belong to one class), and 0.5 is the maximum value, showing maximum disorder when classes are evenly distributed.