Back to: Machine Learning
Understanding Logistic Regression: A Simple Guide
- Logistic Regression is a method for solving classification problems.
- Unlike Linear Regression (which predicts continuous numbers like temperatures or prices), Logistic Regression gives probabilities as output.
- These probabilities are mapped to classes (e.g., “Yes” or “No”) using a function called the logistic sigmoid function.
Linear Regression : Predicts a contineous outcome based on the sum of the weighted inputs , it fits a line to the data points.
Logistic Regression : Predicts a categorical outcome , instead of fitting a line , it fits an “S-shaped” logistic function known as sigmoid function. The output of the sigmoid function is used to categorize the data into classes(usually o/1)
The Sigmoid Function: The Heart of Logistic Regression
The sigmoid function is the mathematical backbone of Logistic Regression. Its formula:

Here:
- z is the weighted sum of the inputs (like in Linear Regression).
- The function transforms z into a value between 0 and 1, representing the probability of a data point belonging to a specific class.
For example:
- A sigmoid output of 0.9 indicates a high likelihood of belonging to class 1 (e.g., “Yes”).
- An output of 0.2 suggests the data likely belongs to class 0 (e.g., “No”).
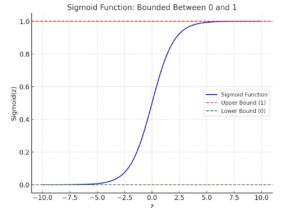
Here is the graph of the sigmoid function. It shows how the function smoothly transitions between 0 and 1, making it ideal for probabilities:
- When z is very large, the sigmoid output approaches 1 (upper bound).
- When z is very small (negative), the output approaches 0 (lower bound).
Mathematical Foundation of Logistic Regression
At the core of Logistic Regression is a mathematical concept involving odds and log odds. These concepts allow the model to transform probabilities into a form suitable for predicting classifications.
What Are Odds in Probability?
Odds in probability is the ratio of the probability that the event will occur to the probability that it will not occur
Formula:
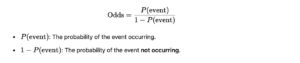
Example:
Imagine you’re predicting whether it will rain tomorrow:
- If the probability of rain is P(event)=0.8
Then the probability of no rain is 1−P(event)=0.2 - The odds of rain are: Odds=0.8/0.2=4 This means rain is 4 times more likely than no rain.
What Are Log Odds?
Log odds (also called the logit) are the natural logarithm of the odds. The formula is:
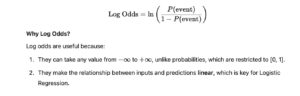
Example:
Using the same rain prediction example:
- Odds of rain = 4.
- Log odds = ln(4)≈1.39
- This means the log odds of rain happening is 1.39.
Understanding the Model Formulation of Logistic Regression
Model Formulation : logistic regression models the log odds of the dependent binary outcome as a linear relationship with the independent valraibles
Understanding the Model Formulation of Logistic Regression
logistic regression models the log odds of the dependent binary outcome as a linear relationship with the independent variables.
The Formula for Logistic Regression
The formula for logistic regression looks like this:
log odds or z =β0+β1×1+β2×2+⋯+βnxn
Here:
- β0 is the intercept.
- β1,β2,…,βn are the coefficients of the features.
- x1,x2,…,xn are the independent variables (e.g., temperature, humidity, age, etc.).
From Log Odds to Probability
Once we have the log odds z, we can convert it into a probability using the sigmoid function:

A Real-World Example
Let’s predict whether it will rain tomorrow using temperature and humidity as features. Suppose the logistic regression model gives the following equation for the log odds of rain:
Now, assume:
- Temperature = 30°C
- Humidity = 70%
Substitute these values into the formula for zz:
Next, use the sigmoid function to convert the log odds into a probability:


Maximum Likelihood Estimation (MLE) for Logistic Regression
Maximum Likelihood Estimation (MLE) is a statistical method used to estimate the parameters of a model by finding the values of the parameters that maximize the likelihood of observing the given data.
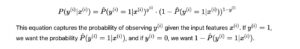
Understanding the Logistic Regression Model
In logistic regression, we model the probability of an event occurring as a function of the independent variables (features). The logistic function (sigmoid) transforms the linear combination of inputs into a probability value between 0 and 1.
The logistic regression model can be written as: ![]()
Where:
- P(y=1∣x) is the probability that the event occurs (i.e., y=1).
- β0,β1,…,βn are the coefficients (parameters) of the model.
- x1,x2,…,xn are the independent variables (features).