Back to: Machine Learning
K-Nearest Neighbors (KNN) Algorithm
The K-Nearest Neighbors (KNN) supervised algorithm is one of the simplest and most effective machine learning algorithms for both classification and regression tasks.
It relies on the distance metrics to determine the closeness of data.It predicts the class of a given point based on the majority class of k it’s nearest neighbours.
k is the positive integer , typically not very large , if k-1 , then the new data is just assigned to the class of it’s nearest neighbor
How Does KNN Work?
KNN operates on a simple principle: data points that are close together are more likely to share similar characteristics.
The algorithm determines the class or value of a new data point by analysing the k nearest neighbours around it, where k is a user-defined parameter.
- For Classification:
- The new data point is assigned to the class most common among its kk nearest neighbors (majority voting).
- For Regression:
- The predicted value is the average (or weighted average) of the target values of its kk nearest neighbors.
KNN Classification Example
Scenario:
A company wants to predict whether a customer will Buy or Not Buy based on their Age and Salary.
Dataset (Training Data):
| Age | Salary | Class (Buy) |
|---|---|---|
| 25 | 40000 | Yes |
| 30 | 50000 | No |
| 35 | 60000 | Yes |
| 40 | 70000 | No |
| 50 | 80000 | Yes |
Query Point:
- Age: 37
- Salary: 65000
Step 1: Calculate distances using Euclidean formula
The Euclidean distance is given by: ![]()
KNN Classification Example (Continued)
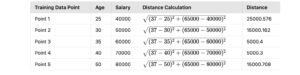
Let’s continue with the dataset and calculate the Euclidean distances between the query point (37,65000)(37, 65000) and each training data point:
Step 1: Calculate distances using Euclidean formula
The Euclidean distance formula is:![]()
Here, x1 and x2 represent the Age values, while y1 and y2 represent the Salary values.
Step 2: Find the k nearest neighbors
Let’s assume k=3 . The 3 nearest neighbours are:
- Point 3 (35,60000)
- Point 4 (40,70000)
- Point 2 (30,50000)
Step 3: Perform majority voting
Check the class labels of the nearest neighbours:
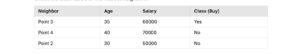
Out of the 3 nearest neighbors, 2 have the class No, and 1 has the class Yes. Therefore, the predicted class for the query point (37,65000) is:
Predicted Class: No
Regression Example: Predicting House Prices
Scenario
A real estate agency wants to predict the price of a house based on its size (sq. ft) and number of bedrooms using historical data.
Dataset (Training Data)
| Size (sq. ft) | Bedrooms | Price (in $1000s) |
|---|---|---|
| 1500 | 3 | 200 |
| 1800 | 4 | 250 |
| 2400 | 4 | 300 |
| 3000 | 5 | 450 |
| 3500 | 5 | 500 |
Query Point
We want to predict the price of a house with:
- Size: 2000 sq. ft
- Bedrooms: 4
Step 1: Calculate the distances
Use the Euclidean distance to calculate the distance between the query point (2000,4)and each data point:
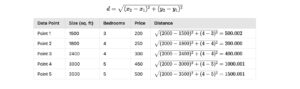
Step 2: Select the kk nearest neighbors
Let k=3 nearest neighbours are:
- Point 2: (1800,4,250)
- Point 3: (2400,4,300)
- Point 1: (1500,3,200)
Step 3: Calculate the predicted price
The predicted price is the average of the prices of the 3 nearest neighbors:
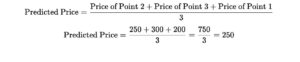
Predicted Result
The predicted price for the house with a size of 2000 sq. ft and 4 bedrooms is $250,000.