Back to: Machine Learning
Error Metrics in Classification: A Simple Guide
When evaluating the performance of classification models, choosing the right error metrics is crucial.These metrics help determine how well your model predicts the correct class labels.
Understanding Actual Positive, Actual Negative, Predicted Positive, and Predicted Negative
In classification, these terms are essential for calculating error metrics. Let’s break them down with definitions and a simple example.
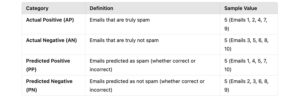
1. Definitions
- Actual Positive (AP): Instances that truly belong to the positive class (e.g., emails that are actually spam).
- Actual Negative (AN): Instances that truly belong to the negative class (e.g., emails that are not spam).
- Predicted Positive (PP): Instances predicted by the model as belonging to the positive class.
- Predicted Negative (PN): Instances predicted by the model as belonging to the negative class.
These terms are used to populate the confusion matrix, which is the foundation for most metrics.
2. Sample Data
Imagine a binary classification problem where a model predicts whether an email is Spam or Not Spam. Below is the actual and predicted data for 10 emails:

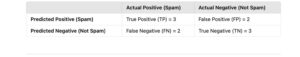
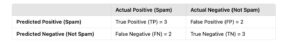
3. Confusion Matrix
Using the sample data, we can calculate the components:
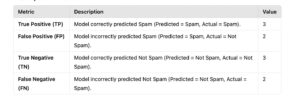
4. Component Breakdown
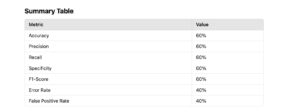
5. Summary in Tabular Format
Let’s explore common error metrics used for binary and multiclass classification, along with simple examples to make the concepts clear.
Error Metrics for Binary Classification (Spam Example)
Here we calculate the error metrics using the given confusion matrix:
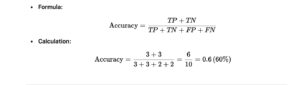
1. Accuracy
- Definition: The proportion of correctly classified observations (both positives and negatives) to the total observations.
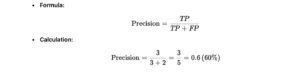
2. Precision (Positive Predictive Value)
- Definition: The proportion of correctly predicted positive observations to all predicted positive observations.
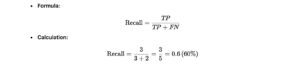
3. Recall (Sensitivity or True Positive Rate)
- Definition: The proportion of actual positive observations that are correctly predicted.
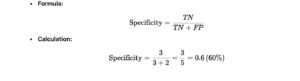
4. Specificity (True Negative Rate)
- Definition: The proportion of actual negative observations that are correctly predicted.
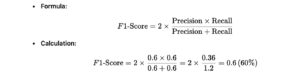
5. F1-Score
- Definition: The harmonic mean of Precision and Recall.
6. Error Rate
- Definition: The proportion of incorrectly classified observations to the total observations.

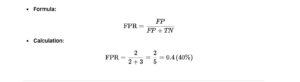
7. False Positive Rate (FPR)
- Definition: The proportion of actual negative observations that are incorrectly predicted as positive.
Real-Time Example: Multiclass Classification(Disease Diagnosis)
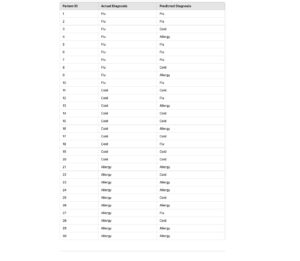
A machine learning model predicts whether a patient has Flu, Cold, or Allergy based on symptoms. Doctors use this model to assist in diagnosis. Here’s the actual and predicted data for 30 patients:
Step 1: Dataset of Patients
Here is a dataset of actual and predicted diagnoses for 30 patients:
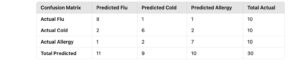
Step 2: Create the Confusion Matrix
Using the above data, we calculate the confusion matrix. Here’s the tabulation of actual vs. predicted:
Step 3: Calculate Error Metrics
Using this confusion matrix, we calculate all error metrics step by step.
1. Overall Accuracy
- Definition: The proportion of correctly classified samples out of all samples.

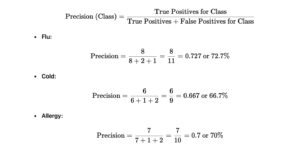
2. Precision for Each Class
- Definition: The proportion of correctly predicted instances for a class out of all instances predicted as that class.
3. Recall (Sensitivity) for Each Class
- Definition: The proportion of correctly predicted instances of a class out of the actual instances of that class.

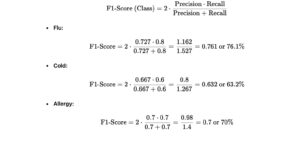
4. F1-Score for Each Class
- Definition: The harmonic mean of precision and recall.
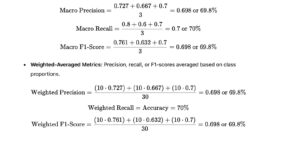
5. Macro and Weighted Metrics
- Macro-Averaged Metrics: Unweighted mean of precision, recall, or F1-scores across all classes.